

- -the EUR/INR is projected to make a modest upside push in 2026.
- - the implied value of this pair will depend on the performance of the USD/INR and the EUR/USD in 2026.
Table of Contents
- Live Chart
- EUR/INR 2026: Revised Institutional Forecasts
- EUR/INR 2030
- EUR/INR 2040
- Macroeconomic Drivers of Euro-Rupee Trends
- Technical Outlook and Volatility Analysis
- FAQ
- What is the current EUR to INR exchange rate today?
- Why is the EUR to INR rate increasing recently?
- Is the Euro a good investment against the Rupee for 2026?
- How often do EUR to INR exchange rates change?
As of writing on 13 April 2026, the EURINR currently trades at 109.90. The EUR/INR can be looked at as a synthetic cross between the EUR/USD and the USD/INR. Both currency pairs and the fundamental drivers behind their 2026 forecasts have been covered on this website.
Remember:
At the start of the year when this article was first written, I had stated that the EUR/USD’s 2026 trend would be determined primarily by the rate differential dynamics between the Fed and the ECB, while the USD/INR would be driven by RBI policy, crude oil prices, portfolio flows, and India’s trade balance.
Well, things have changed radically, as a new macro driver hit the markets in the form of the US-Iran war. The war has led to strikes and counter-strikes on key energy facilities in Iran and around the Middle East, ultimately leading to the closure of the Strait of Hormuz, a critical artery for global oil shipping.
The situation has sent oil prices soaring, creating the oil shock risk premium that is now dictating price action across several markets, including the EUR/INR. The oil shock has now altered the macro fundamentals of this pair, and the EUR/INR is now expected to trade as a direct response to the impact of the oil shock on European markets and Indian markets.
Live Chart
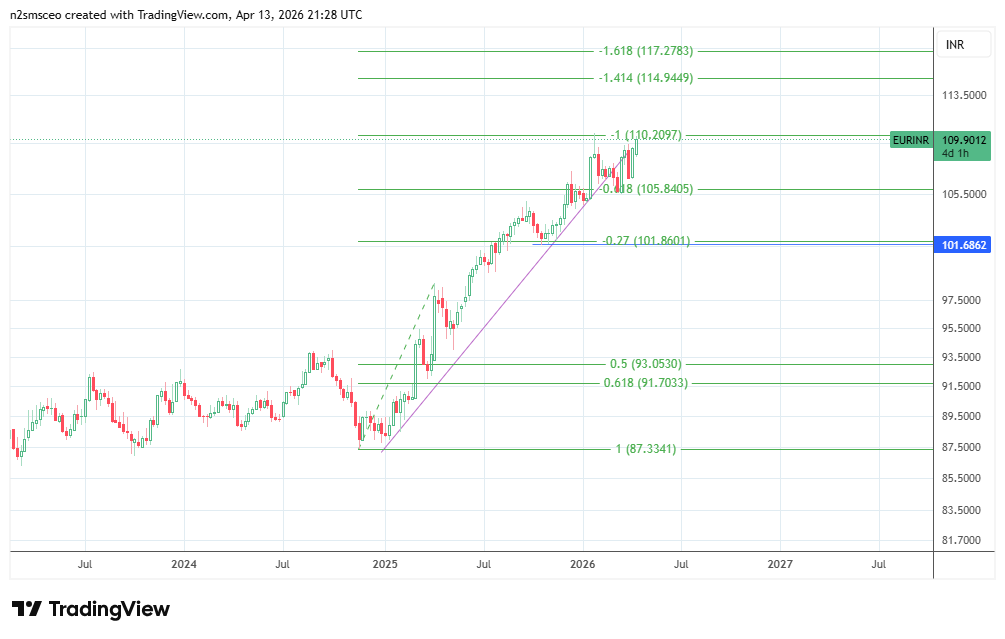
Following a period of consolidation between 2023 and 2025, the EUR/INR has broken to the upside and now remains in an uptrend. This uptrend has been exacerbated by the oil shock, which has hit the Indian Rupee hard and sent it into record-low territory against the Euro and the US Dollar.
EUR/INR 2026: Revised Institutional Forecasts
Here are the 2026 EUR/INR institutional forecasts. Please note that it is customary for banks to publish the forecasts of the EUR/USD and USD/INR and not the EUR/INR directly. So any price targets indicated below are derived from the cross of these two currency pairs.
EUR/INR ≈ (USD/INR) × (EUR/USD)
MUFG provided a quarterly forecast update on 2 February 2026. It calls for the EUR/USD and USD/INR to trade as follows:
| Currency | End-Q1 | End-Q2 | End-Q3 | End-Q4 |
| EUR/USD | 1.20 | 1.22 | 1.24 | 1.25 |
| USD/INR | 89.5 | 91.5 | 93.0 | 93.0 |
The implied value of the EUR/INR at the end of each quarter is:
- Q1: 107.4
- Q2: 111.6
- Q3: 115.3
- Q4: 116.3
ING’s 10 February 2026 update provides the end-of-quarter values for each currency pair as follows:
| Currency | End-Q1 | End-Q2 | End-Q3 | End-Q4 |
| USD/INR | 90.3 | 90.5 | 89.5 | 89.0 |
| EUR/USD | 1.19 | 1.20 | 1.21 | 1.22 |
| EUR/INR | 107.5 | 108.0 | 108.3 | 108.6 |
The latest updates are a product of banks’ assumptions of higher energy prices, continued vulnerability of the Rupee to these energy price spikes, and the hawkish repricing of the ECB’s rate pathway due to heightened Eurozone inflation expectations.
This implies that institutional EUR/INR forecasts for 2026 have been largely revised upwards for several reasons.
India is a net oil importer, so an oil price >$100/bbl worsens the rupee’s terms of trade and raises energy-driven inflation risks. A Reuters report of 13 April indicated that the Rupee fell to about 93.375 per dollar after oil prices rose overnight on the failed ceasefire talks.
On the euro side, the oil shock is driving inflation expectations. Reuters hints that markets are abandoning the dovish expectations for the ECB and are currently pricing in two ECB hikes. There is also a 70% chance of a third hike by end-2026. ECB Vice President de Guindos indicated that hikes could happen if the oil shock broadened second-round inflation effects.
Morgan Stanley’s updated oil path sees Brent crude trading at $110 in Q2 2026 and $100 in Q3 2026. This implies that ending the oil shock would not end the impact of the blockaded oil shipping overnight. This could raise upside risks to India’s inflation and balance-of-payments narrative far longer than expected.
The institutional base case for EUR/INR in 2026 sees the pair trading at 109–111 for several months, with the price inching towards the upper end of the range towards year-end if oil prices remain elevated. This is in keeping with a pressured Rupee and a Euro benefiting from a less dovish ECB.
EUR/INR 2030
There are no explicit bank-driven forecasts for EUR/INR in 2030. Most sell-side forecasts cover only a 12-24-month time frame. You can, however, look at sources that offer insight into the 2030 forecasts for the pair. These sources include:
a) ECB Survey of Professional Forecasters, who provide a Euro-area long-term inflation report.
b) India inflation framework, which sees India’s inflation target at 4%, which falls within the RBI’s framework of 2%-6%.
Based on these two sources, the inflation-differential for EUR/INR in 2030 (4% – 2% = 2%/year) implies an 8% uptick in EUR/INR over the next 4 years.
With a starting price of 107.60, the base case sees the EUR/INR trading at 116.5 by 2030. The bear and bull case scenarios see the pair trading at 112.0 and 121.1, respectively.
Please note that these are purely implied prices and not based on institutional FX analysis.
EUR/INR 2040
There are currently no EUR/INR 2040 forecasts as this time period falls outside the forecasting time frames used by institutional analysts.
Macroeconomic Drivers of Euro-Rupee Trends
When it comes to the fundamental drivers of EUR/INR in 2026, we need to look at it from both currency legs.
From the INR’s standpoint, the currency’s main drivers after the oil shock commenced are:
- RBI policy in stabilizing a severely weakened Rupee.
- Foreign portfolio flows in response to the war headlines
- US Dollar demand from importers, corporates, and portfolio investors

1. RBI Interventionist Policy
The Reserve Bank of India’s policy of intervening to prevent a sharp slide in the Rupee has become topical. The RBI was reported to have sold US Dollars before the local opening of the FX spot market on 12 February, in a move that discouraged a buildup of short Rupee positions. An unnamed trader said the intervention could dent expectations of USD/INR rising above 91.00 in the near term.
Presently, the RBI has ramped up its intervenionist policy due to the hammering the Rupee has taken as a result of its sensitivity to higher energy prices. Despite these efforts, the Rupee is still trading near record-low territory against the Euro.
2. Foreign Portfolio Flows
A large component of the macro behind the Rupee’s steep plunge following the oil shock is the exit of foreign portfolio funds from the Indian stock markets. The Nifty 50 index and several stock markets took a beating as foreign funds sold off their holdings and hit the exit door. In leaving the markets, these funds converted their Rupee-based holdings to US Dollars, putting additional pressure on a Rupee already reeling from higher oil prices.
3. Dollar Demand
USD demand from importers and portfolio traders has become a key near-term driver in recent sessions. Typically, the US Dollar is demanded for oil imports (India is the 2nd-largest importer of crude globally) and for foreign portfolio investors looking to cash out their gains from the local bourse for repatriation.
On the Euro leg of the divide, we expect the EUR/USD trend to be driven by the Fed/ECB rate differential in 2026, especially as inflationary expectations have heightened and led to hawkish repricing of ECB rate decisions for 2026.
Technical Outlook and Volatility Analysis
The primary trend is bullish, with price still holding above the ascending trendline support following February’s bounce. This bounce stalled the post-spike pullback on the pair.
The revised trendline on the daily chart shows that the latest uptick came off a bounce from this trendline at the 50% Fibonacci retracement of the 23 October 2025 trough – 29 January 2026 peak. Price is now pushing towards this peak at 110.25. A break above this barrier would take the pair to new record highs, with the 27% Fibonacci extension of this price swing at 112.58 as the next upside target.
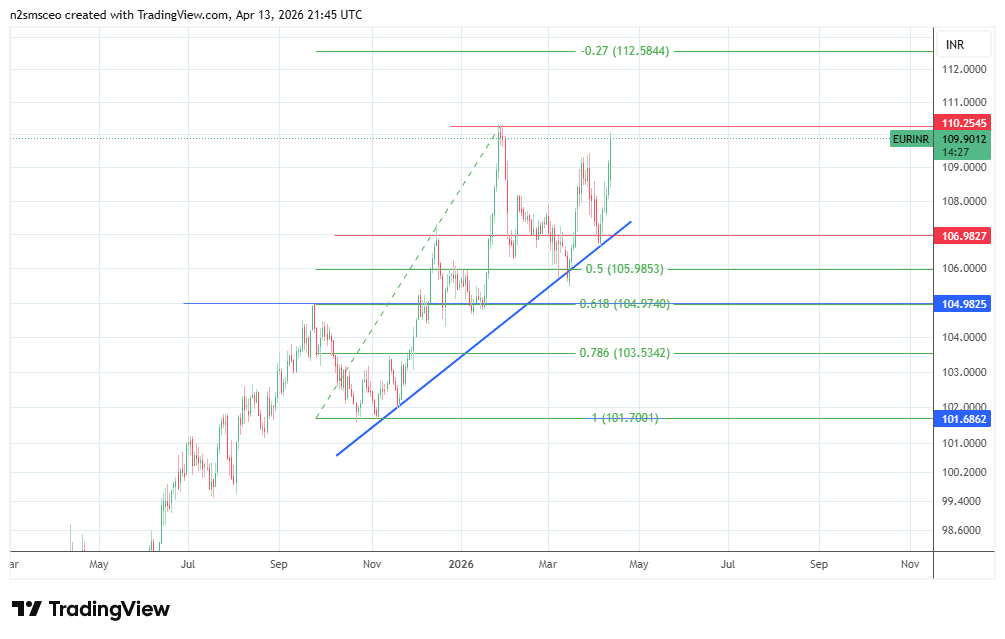
On the flip side, the bullish outlook is only negated if price breaks below the recent swing low at 106.98, targeting the 50% Fibonacci retracement at 105.98, the 61.8% Fibonacci retracement, and the 24 September 2025 low/19 January 2025 high at 104.98. A deeper correction brings in the 78.6% Fibo retracement at 103.53.
FAQ
What is the current EUR to INR exchange rate today?
The EUR to INR exchange rate today indicates a value of 109.90 as of writing.
Why is the EUR to INR rate increasing recently?
The Rupee has been severely weakened by the oil shock which has led to a spike in oil prices.
Is the Euro a good investment against the Rupee for 2026?
Yes, institutional projections and the macro drivers all point towards a further gain by the EUR/INR, if the war headlines continue to move towards escalation.
How often do EUR to INR exchange rates change?
They change very frequently, as the EUR/INR pair is inherently tied to EUR/USD and USD/INR volatility.

 AAPL
AAPL
 MSFT
MSFT
 META
META ^NDX
^NDX BTC-USD
 XRP-USD
 SUZLON.NS
 INR=X
INR=X EURUSD=X
 JPY=X
JPY=X CAD=X
CAD=X